Best KPI Dashboard Software in 2026: 9 Tools Compared
Christian MontenegroNovember 1, 202611 min read

The best KPI dashboard software is the one your team opens every day. For analysts with messy data, that usually means Power BI, Tableau or Looker Studio. For marketing and sales numbers on a screen, it means Databox or Geckoboard. For owners and managers of frontline teams, where KPIs come from work getting done, our pick is Bossy, which ties daily tasks to goals and proves the work with photos. Below we compare nine options with published prices, then show how to roll one out so it sticks.
TL;DR
- Bossy is built for owners and managers of 3 to 150 frontline employees: tasks, goals and verified work feed the numbers. Paid plans run $25 to $50 per month.
- Databox and Geckoboard are the quickest ways to put marketing and sales KPIs on a screen. Geckoboard starts at $49/month, Databox Pro at $159/month billed annually.
- Power BI, Tableau, Looker Studio and Qlik suit teams with data skills and many data sources. Looker Studio is free.
- A dashboard only works with a review routine: owners for each KPI, a regular meeting, and an agreed action when a number slips.
Table of Contents
- What a KPI dashboard tool should do for a small or frontline team
- The tools at a glance
- Bossy: KPIs that come from verified work
- Geckoboard: live KPIs on the wall
- Databox: marketing and sales KPIs with templates
- Klipfolio: custom metrics and client-facing dashboards
- Looker Studio: free reporting for Google data
- Tableau and Power BI: when you have analysts
- Qlik, ThoughtSpot, Coupler.io and KPILIO
- How to choose: three quick questions
- From dashboard to results: a rollout that sticks
- Our perspective
- Try Bossy for your frontline team
- FAQ
- Sources
What a KPI dashboard tool should do for a small or frontline team
Most lists of KPI tools assume you have a data team. If you run a restaurant, a salon, a few shops or a warehouse, you probably don't. Your KPIs live in things people do: the opening checklist, the stock count, the shift that started on time.
So judge a tool on a short list:
- Where the numbers come from. Does it pull from systems you already use, or from work your team does in the tool itself?
- Who can read it. Managers on a phone, not just someone at a desk.
- How fast you can set it up. If it takes a month, it won't get built.
- What happens after a number drops. A chart that nobody acts on is wallpaper.
The research agrees on the buying checklist. Software Advice says to check integrations, mobile access for remote users and ease of use for nontechnical people. TechRepublic's 2026 comparison adds refresh frequency, permissions, customization and total cost, and warns that inconsistent data formats, limited refreshes and technical setup can get in the way.
The tools at a glance
| Tool | Best for | Published starting price |
|---|---|---|
| Bossy | Frontline teams, verified daily work tied to goals | Analytics dashboards on paid plans, $25 to $50 per month; Free plan for task verification |
| Geckoboard | Live TV wallboards | $49/month |
| Databox | Marketing and sales KPIs | Pro $159/month billed annually |
| Klipfolio | Custom metrics, client dashboards | Klips from $120/month; PowerMetrics $18/month billed annually |
| Looker Studio | Free reporting on Google data | Free; Pro $9 per user per project per month |
| Tableau | Data analysts | Cloud Standard from $15 per user per month, billed annually |
| Power BI | Teams on Microsoft tools | See Microsoft's pricing page |
| Qlik Cloud Analytics | Small businesses wanting guided analytics | From $300/month billed annually for 10 users |
| ThoughtSpot | Natural language questions | Analytics Essentials from $25 per user per month, billed annually |
Prices are the starting points the vendors or reviewers published in 2026. Viewer licenses, extra data sources and embedding fees can push the real bill higher, so confirm on each pricing page.
Bossy: KPIs that come from verified work
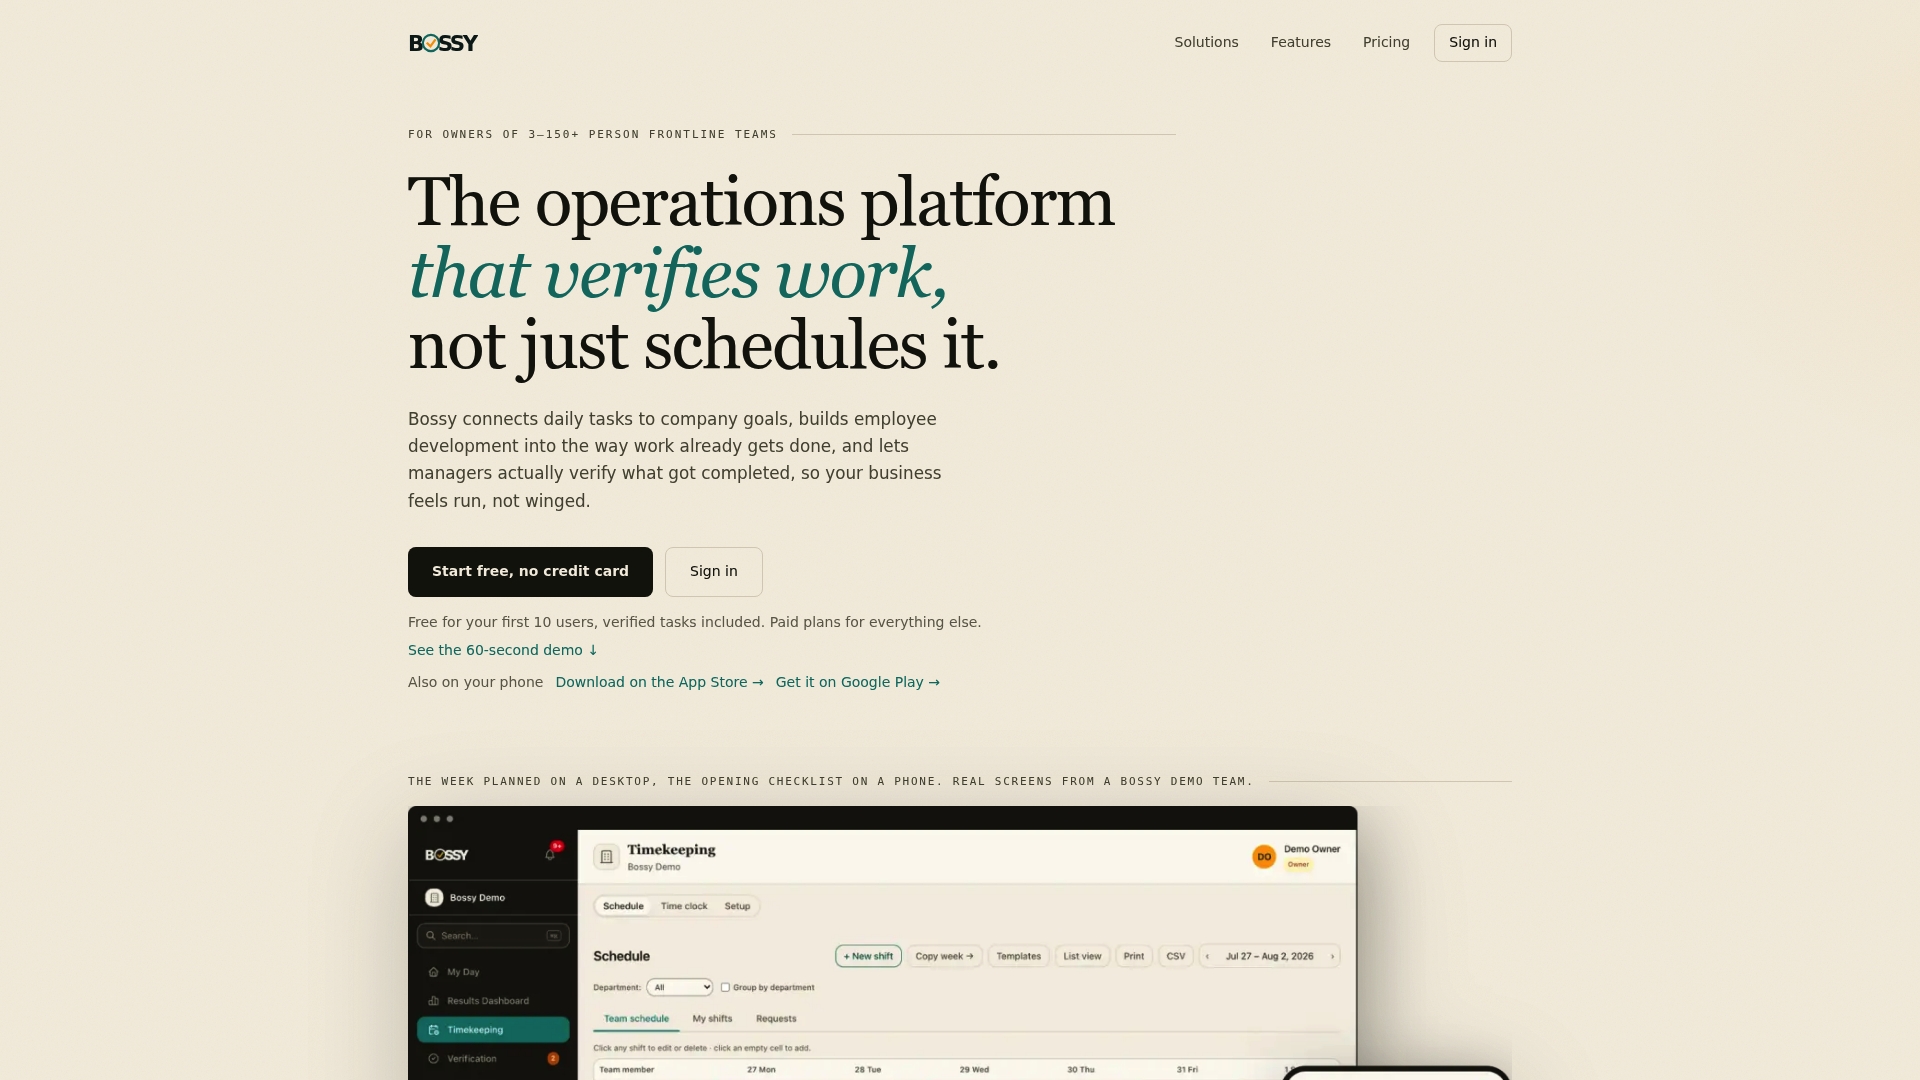
Most dashboards show you a number and leave you to guess why it moved. We built Bossy the other way around. Your goals cascade down to daily tasks, your team completes those tasks with photo proof, and a manager approves them in a queue. The numbers on the analytics dashboards reflect work that was checked, not work somebody ticked off.
What that gives a manager who isn't standing over every shift:
- Task assignment and verification, with photo proof and an approval queue
- Recurring operational checklists
- Employee scheduling and geofenced time clocks
- Inventory control: stock counts, ordering and transfers
- Team chats, announcements, voice notes and polls
- Cascading goals, analytics dashboards and audit logs
- 1-on-1s, feedback and growth tasks for developing people
Pricing is published on the Bossy pricing page: a Free plan for task assignment and verification, then Growth at $25 per month, Operations at $30 per month and Scale + at $50 per month. Additional users on paid plans are $5 per month each, and Enterprise is available too. Bossy through Shopify is $79 per month, with everything in Scale +, billed through your Shopify account. Analytics dashboards come with every paid plan; cascading goals, photo proof, checklists, scheduling and inventory come with Operations; chat and 1-on-1s come with Growth; Scale + has both.
It isn't a tool for blending ten data sources into a chart, and you don't build custom KPI charts from outside data in it. Its dashboards show completion rates, time on task and trends from the work your team does in Bossy. It is for owners who want to know whether the opening checklist was really done, whether the stock count matched and whether goals are moving. If you are choosing metrics first, our guide to 3 to 5 team performance metrics is a good start. If you are weighing us against a scheduling tool, see the Bossy vs Connecteam comparison.

Geckoboard: live KPIs on the wall
Geckoboard is built for live KPI TV wallboards and has a quick setup. Domo's roundup lists it from $49/month. Geckoboard says it connects to HubSpot, Zendesk, Salesforce and 90+ tools, so it suits support and sales floors where everyone should see the same number all day.
Pick it if: your KPIs live in SaaS tools and you want a screen in the office.
Databox: marketing and sales KPIs with templates
Databox has 130+ integrations plus pre-built templates and metrics for marketing and performance tracking. Its Pro plan costs $159/month billed annually. A Tajo comparison presents it, with Geckoboard, as one of the easy ways to get KPIs on a screen.
Pick it if: you run marketing or sales and want ready-made metrics, drag-and-drop dashboards and no analyst.
Klipfolio: custom metrics and client-facing dashboards
Klipfolio is known for formula-based custom metric building. According to SaaSRat, Klips start at $120/month and PowerMetrics at $18/month billed annually. The same Tajo guide says Klipfolio rewards the effort you put into setup.
Pick it if: you need custom calculations or dashboards for clients, and someone has time to build them.
Looker Studio: free reporting for Google data
Google says Looker Studio is free for creators and report viewers. Looker Studio Pro is $9 per user per project per month. It is a sensible first dashboard if your data already sits in Google products.
Tableau and Power BI: when you have analysts
Tableau Cloud Standard starts at $15 per user per month, billed annually. Tableau has a learning curve, so it suits data analysts. Power BI suits teams already in the Microsoft world, and Microsoft publishes a useful explainer on KPI dashboards.
The Domo guide puts the split simply: Tableau for analysts, Power BI for Microsoft shops.
Qlik, ThoughtSpot, Coupler.io and KPILIO
- Qlik Cloud Analytics: small-business plans start at $300/month billed annually for 10 users.
- ThoughtSpot: search-first AI analytics with natural language search. Analytics Essentials starts at $25 per user per month, billed annually.
- Coupler.io: moves data from sources into spreadsheets, BI tools and warehouses, with some built-in visualization. Starter is $24/month billed annually, with 3 accounts and daily refreshes.
- KPILIO: annual plans start at $790 and include AI question and alert features.
How to choose: three quick questions
Where does your data live? In SaaS tools like a CRM or ad platform: Databox, Geckoboard or Klipfolio. In spreadsheets: Coupler.io or Looker Studio. In the daily work of a floor team: Bossy.

Who will build and read it? If nobody on your team likes data, pick the tool with templates or the one that produces numbers as a side effect of work.
What does it cost at your headcount? Per-user pricing grows as you hire. Most client dashboard tools charge per user or workspace and add fees for extra data sources. With 40 hourly employees, a per-seat price matters far more than the headline figure.
From dashboard to results: a rollout that sticks
Buying software is the easy half. Here is what the guidance from Microsoft, KPI.org and Klipfolio boils down to.
- Pick a few KPIs and tie them to goals. Microsoft says a KPI dashboard should connect metrics to strategic objectives, show baseline performance and include a plan for action when numbers change.
- Write definitions down. One reported case found that standardizing KPI definitions reduced reporting inconsistencies and built trust in the dashboard.
- Give every KPI an owner. Notion's team guidance says goals should be specific, measurable and time-bound, each with an owner, with progress recorded regularly.
- Test with the people who use it. Klipfolio's steps include reviewing the dashboard with users and iterating after feedback, and making it a daily habit.
- Hold a weekly review. Microsoft's team-execution guidance suggests looking first at goals marked behind or at risk, comparing with the previous period, naming barriers and leaving with action items.
- Close the loop. KPI.org describes setting targets, acting, tracking, reviewing and adapting. Reporting alone isn't enough.
That last step is where many dashboards stall, because a number tells you something is wrong but not who will fix it. If your next move is developing people, not just measuring them, this leadership roadmap with KPIs and templates covers moving past reporting into performance management. Our own take is in the one-page development plan guide.
Our perspective
Most dashboards measure what already happened. For a frontline team, the number that matters is whether the work got done the way you asked, and a checkbox can't tell you that.
When you aren't on the floor every shift, trust runs on your presence. Take the presence away and you need proof: a photo, an approval, a record. That is why we built Bossy so that tasks roll up to goals and the dashboards reflect verified work.
We also think a KPI without a conversation is just a chart. Scheduling, inventory, communication and development tools such as 1-on-1s and growth tasks sit in the same place, so when a number slips you can talk to the person and set a next step without opening four apps.
If you have a data team and ten data sources, a BI tool is a fine choice. If you have a team of 3 to 150 people doing real work in real places, start with what they do each day.
Try Bossy for your frontline team
If your KPIs come from the work itself, start free and see whether the approval queue matches how you run your day. Analytics dashboards come with every paid plan, and cascading goals with Operations at $30 per month. Paid plans run from $25 to $50 per month, and you can compare them on the Bossy pricing page.
Running a restaurant? See task and team management for restaurants, or browse all Bossy features. For more on measuring a team, read about workforce analytics software.
FAQ
What is the best KPI dashboard software for a small business?
It depends on where your numbers come from. For SaaS data, Databox and Geckoboard are the quickest to set up. For frontline teams where KPIs come from daily tasks, Bossy's analytics dashboards come with its paid plans, from $25 per month, and its Free plan covers task verification.
Is there free KPI dashboard software?
Yes. Looker Studio is free for creators and viewers. Bossy has a Free plan for task verification, but its analytics dashboards start on the paid plans. Free tools tend to work for a first dashboard, then you pay as users, data sources or features grow.
What is the difference between KPI dashboard tools and KPI reporting software?
Dashboards show live or near-live numbers on a screen. Reporting software packages numbers into scheduled reports. Many tools do both, so compare refresh frequency, sharing options and permissions.
How many KPIs should a team track?
Fewer than you think. A KPI tool can help you focus on a few priority metrics, and our guide suggests 3 to 5 team metrics. Give each one an owner and a review date.
Sources
- Best Dashboard Software: Compare 15 Tools + Pricing (Domo)
- The 7 Best Client Dashboard Software (Assembly)
- Klipfolio review and pricing (SaaSRat)
- Looker Studio (Google Cloud)
- Tableau pricing
- Qlik Cloud Analytics pricing
- Coupler.io pricing
- KPILIO pricing
- Conversational analytics software (Dot)
- KPI dashboard tool selection guide (Tajo)
- Best KPI Software (Software Advice)
- 7 Best Dashboard Software for Businesses (TechRepublic)
- What Is a KPI Dashboard (Microsoft Power BI)
- Team Execution Dashboard (Microsoft Learn)
- Replatforming a B2B Analytics Dashboard (Webskyne)
- How to develop KPIs (KPI.org)
- Build a team dashboard (Notion)
- How to Create a KPI Dashboard (Klipfolio)
- 7 Stage Leadership Roadmap for HR Leaders